Grouping Breakdown
This feature is available only if you're in the Early Adopter program. Features available to Early Adopters are still in-progress and may have bugs. We recognize the irony.
If you’re interested in being an Early Adopter, you can turn your organization’s Early Adopter status on/off in General Settings. This will affect all users in your organization and can be turned back off just as easily.
This feature is only applicable for error issues. Other categories of issues (such as, performance issues) do not support this feature.
Sentry's current grouping algorithm puts two error events into the same issue if they have the same stack trace. This approach sometimes creates multiple distinct issues for errors with the same root cause.
If two distinct issues are created occasionally, you may be able to reduce the noise by manually merging those issues. Alternatively, if you want coarser issue groups (thus fewer issues) by default, follow the process outlined here.
Enable the Grouping Breakdown (beta)
Enable our newest grouping algorithm, which creates coarser (that is, fewer) issues by considering only the most relevant part of the stack trace.
Join our Early Adopter program by navigating to Settings > General Settings.
Changing the grouping algorithm
Upgrading the grouping algorithm cannot be undone.
Use the Updated Grouping Breakdown
After enabling the updated grouping algorithm, the grouping breakdown allows you to navigate subgroups of an issue to see what events would group together if a larger part of the stack trace were to be considered. You can do this in the "Grouping" tab of an issue.
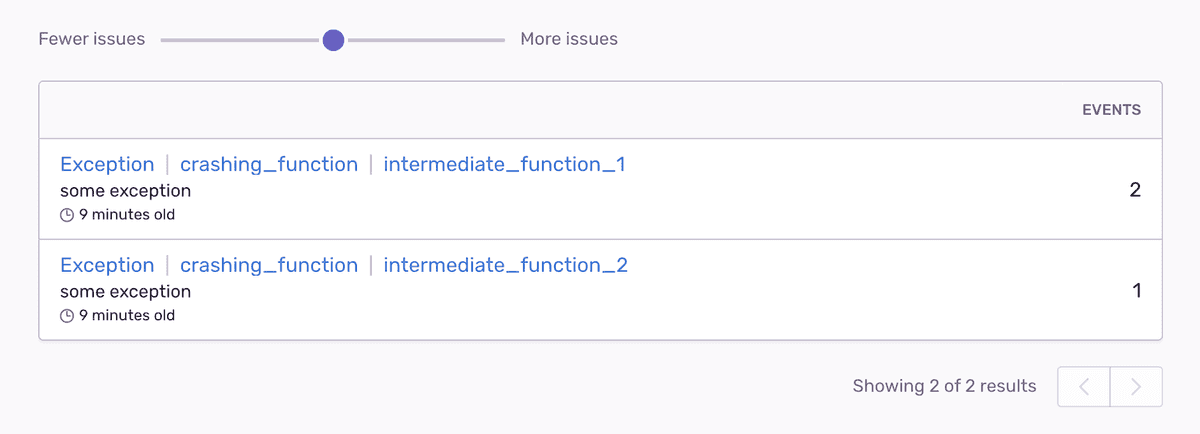
For example, if you have a crashing function called from multiple locations in your code ("intermediate function" "1" and "2"), when you move the slider all the way to the left, only the crashing frame is considered for grouping, and all events are sorted into the same issue regardless of the calling location:
When you move the slider to the right, you can see what groups would be created if the calling frame were also to be considered:
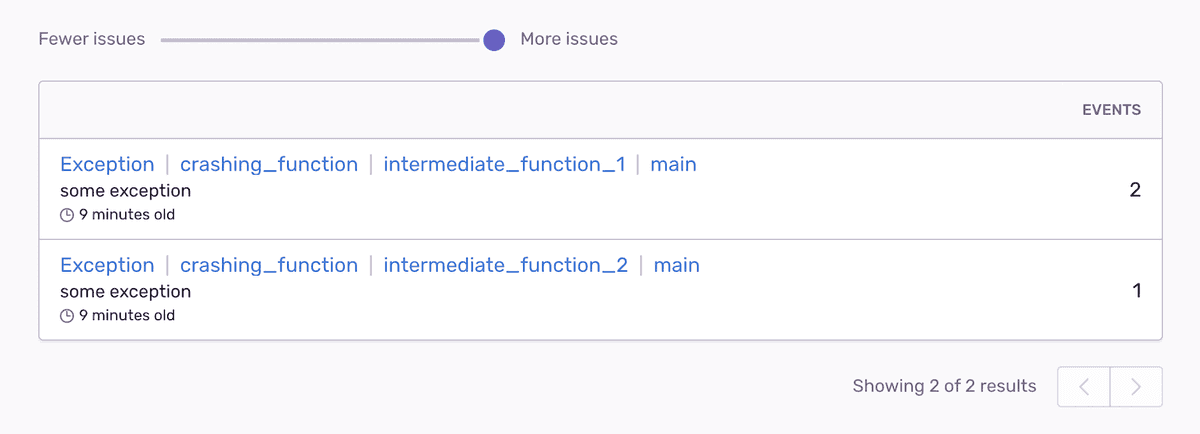
You can add another level by moving the slider all the way to the right. However, this does not add any new subgroups, as both calling functions are themselves called from the same location (main):
Sentinel & Prefix Frames
With Grouping Breakdown enabled, Sentry groups events by identifying the most interesting group of frames it can find in a stack trace.
To mark frames as interesting, use the +sentinel and +prefix actions in Stack Trace Rules. For the first level, our algorithm looks for the first frame X which is marked as sentinel. The
X is also a prefix frame, the next frame Y is also added. If Y is again a prefix frame, the next frame Z is added, and so on.If no sentinel frame is found, every frame that contributes to grouping according to the usual
stack trace rules (for example, +group) constitutes its own level of detail.
Example
Consider a stack trace with functions a, b, c, d, e, f, g, h, with a being the crashing frame
and h being the thread base. Imagine you have the following stack trace rules defined:
function:b +sentinel +prefix
function:c +prefix
function:f +sentinel
In this case
bis used for grouping because it is the first sentinel frame,cis used for grouping becausebis a prefix frame,dis used for grouping becausecis a prefix frame.
This becomes visible in the Breakdown tab:
Increasing the level adds the second sentinel:
Finally, the deepest level contains the entire stack trace, ignoring sentinel and prefix frames:
Our documentation is open source and available on GitHub. Your contributions are welcome, whether fixing a typo (drat!) to suggesting an update ("yeah, this would be better").


