Alert Types
You can create two types of alerts:
- Issue alerts: Trigger when an issue matches a specific criteria.
- Metric alerts: Trigger when macro-level metrics cross specific thresholds.
Issue Alerts
Issue alerts trigger whenever a new event is received for any issue in a project matching the specified criteria. These criteria might be, for example, a resolved issue re-appearing or an issue affecting many users.
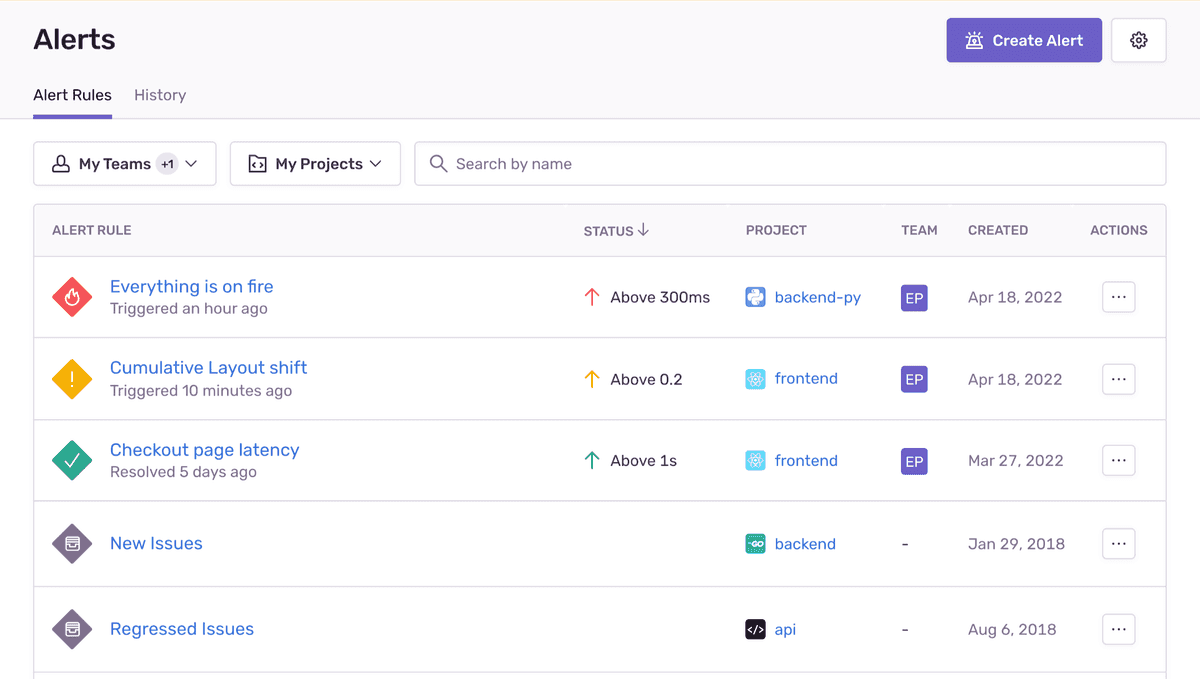
In the “Alert Rules” tab, these alerts are identified by the issues icon, and by default, they are displayed at the bottom of your list of alerts. (If you have several metric alerts, this may push your issue alerts off the first page of the list.)
In issue alerts, Sentry evaluates the configured alert conditions each time it receives a new event. Alert conditions have three parts:
- Triggers specify what type of activity you'd like monitored, or When an alert should be triggered.
- Filters help control noise by triggering an alert only If the issue matches the specified criteria.
- Then, Actions specify what should happen when the trigger conditions are met and the filters match.
Alert Details
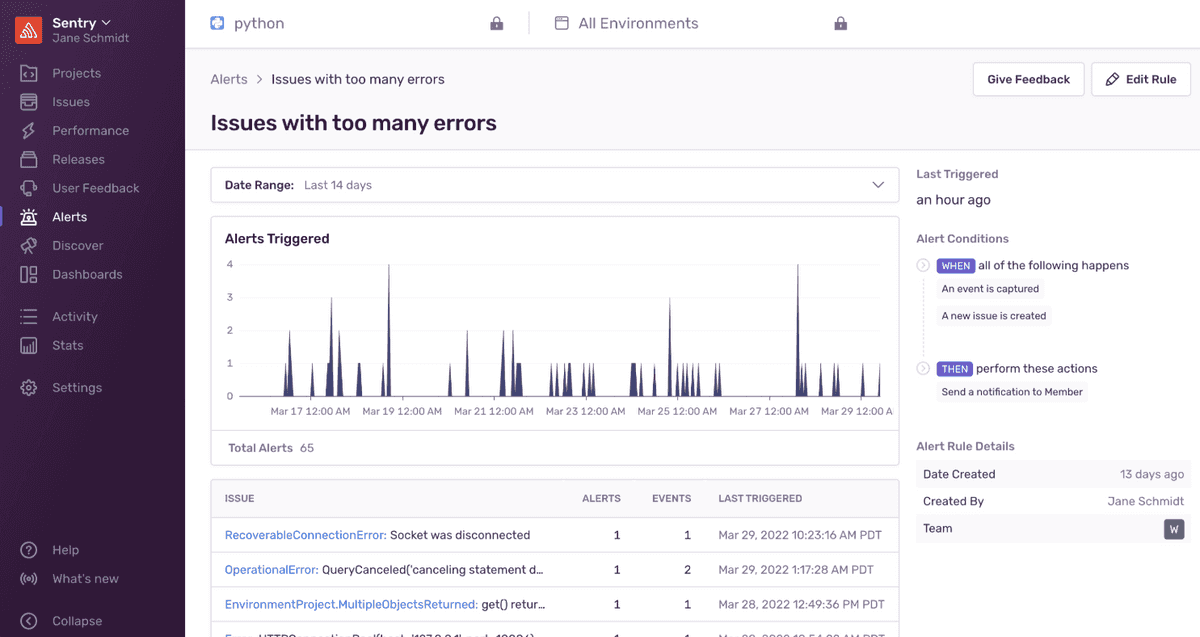
The Alert Details page shows you the number of times an issue alert rule was triggered over time, grouped in one hour buckets. Clicking on the alert rule name in the "Alert Rules" tab, or on the notification you receive will take you to this page. The page also includes the alert rule conditions, the current status of the alert (Warning, Critical, or Resolved), and alert details such as when it was created, when it was last modified, and the team that owns the alert.
The Alert Details page also includes a list of issues that triggered the alert. You can click on any of the issues in the list to go to that issue's details page for more information.
Metric Alerts
Metric alerts tell you when a metric crosses a threshold, such as a spike in the number of errors in a project, or a change in a performance metric, like latency, Apdex, failure rate, or throughput.
Metric alerts monitor macro-level metrics for both error and transaction events. A metric takes a set of events and computes an aggregate value using a function, such as count() or avg(), applied to the event properties over a period of time. When you create a metric alert, you can filter events by attributes and tags, which is particularly useful for aggregating across events that aren't grouped into single issues.
Metric alerts aren’t affected by ignored issues, so events from those issues are counted if they match the filters of your metric alert rule.
These alerts use Critical and Warning triggers to measure severity. An alert’s current status is the highest severity trigger that is active, which can be one of three values: Warning, Critical, or Resolved. Sentry notifies you whenever an alert's status changes.
When you create an alert, all the displayed alert types (except “Issues”) may be used to create a metric alert. You can create metric alerts for Errors, Sessions (Crash Rate Alerts), and Performance:
Errors
- Number of Errors
- Users Experiencing Errors
Sessions (Crash Rate Alerts)
This feature is available only if your organization is on a Team plan or higher.
Crash rate alerts tell you when the crash free percentage for either sessions or users falls below a specific threshold. This could happen because of a spike in the number of session or user crashes. Use crash rate alerts to monitor the health of your application per project, or in a specific release
- Crash Free Session Rate
- Crash Free User Rate
Performance
- Throughput
- Transaction Duration
- Apdex
- Failure Rate
- Largest Contentful Display
- First Input Delay
- Cumulative Layout Shift
- Custom Metric
Alert Details
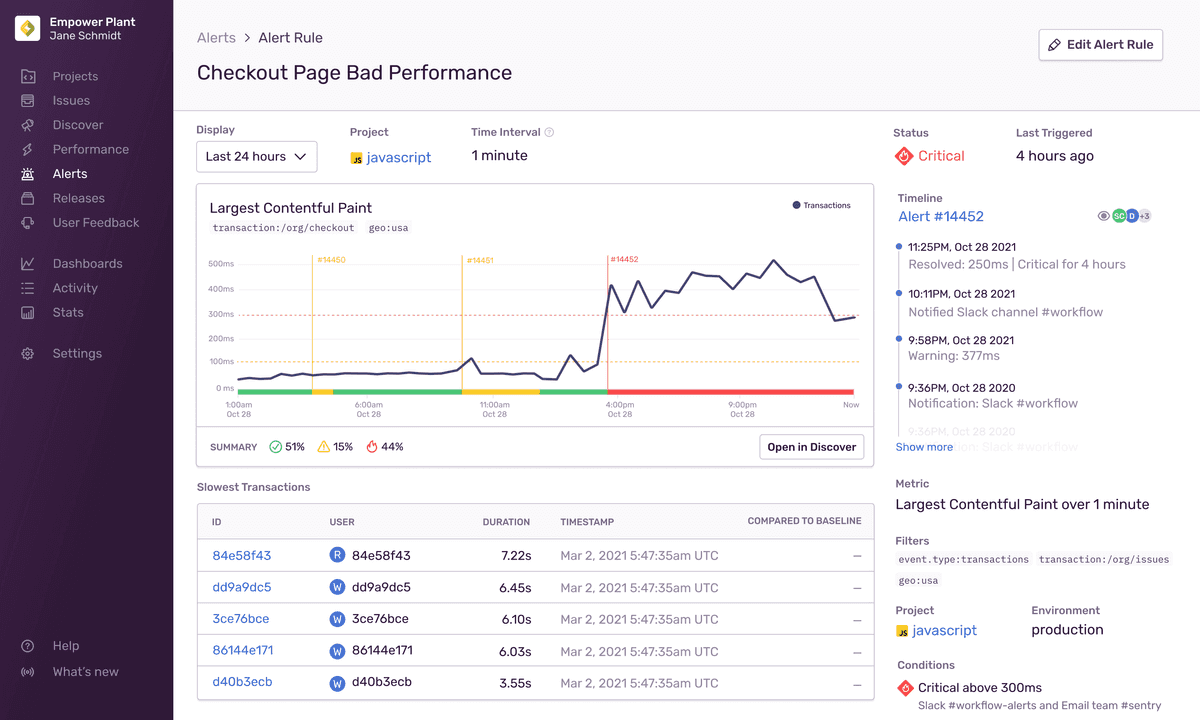
The Alert Details page shows you the history of a metric alert rule for the last 24 hours by default, though can modify the time period using the "Display" dropdown. When an alert is triggered, clicking the notification you receive takes you to this page, which displays the period when the alert was active. The page also includes details such as the alert rule conditions, the current status of the alert, and a summary of how much time the alert spent in each state (Critical, Warning, or Resolved).
The Alert Details page also includes a list of suspect issues or transactions related to the metric, to help pinpoint the root problem more quickly. You can see what might have caused the alert to be triggered, and then open the metric in Discover to find more information.
Our documentation is open source and available on GitHub. Your contributions are welcome, whether fixing a typo (drat!) to suggesting an update ("yeah, this would be better").


